Market Analysis and Investment Opportunities in CEE Logistics Sector
Amid the bustling logistics landscape in Central and Eastern Europe (CEE) at the dawn of 2026, a significant milestone has been reached: the logistics market’s worth has surged to €163.63 billion, showcasing steadfast growth despite global challenges. This isn’t just about numbers; it’s a significant turnaround in European supply chains, now positioning CEE as a pivotal connector between Western Europe and Asia. As nearshoring continues to rise and e-commerce gains traction, grasping the transformative forces at play in the CEE logistics sphere becomes crucial for both investors and operators.
The intriguing aspect of this market evolution is its timing. While Western Europe contends with outdated infrastructure and crowded cities, CEE countries are launching state-of-the-art facilities, ready to meet modern supply chain needs. The figures tell the story: investment in the region climbed by a remarkable 143% in early 2025 compared to the previous year, adding to a jump of 70% in 2024. This is not merely growth; it signifies a reconfiguration of logistics across Europe.
For those investing in or operating within the sector, the ramifications extend past mere property statistics. This discussion will dive into how overlapping trends in e-commerce, manufacturing reshoring, and technology advancements are sculpting unique opportunities throughout the CEE region. We’ll uncover why countries like Poland control 48% of the local logistics inventory, while emerging markets like Romania see the swiftest developments in new facilities.
By decoding these factors, stakeholders can strategically align themselves for the impending phase of market growth, whether that involves strategic placements, tech investments, or portfolio adjustments. The real takeaway? CEE’s logistics arena isn’t just expanding; it’s utterly transforming the mechanics of European trade.
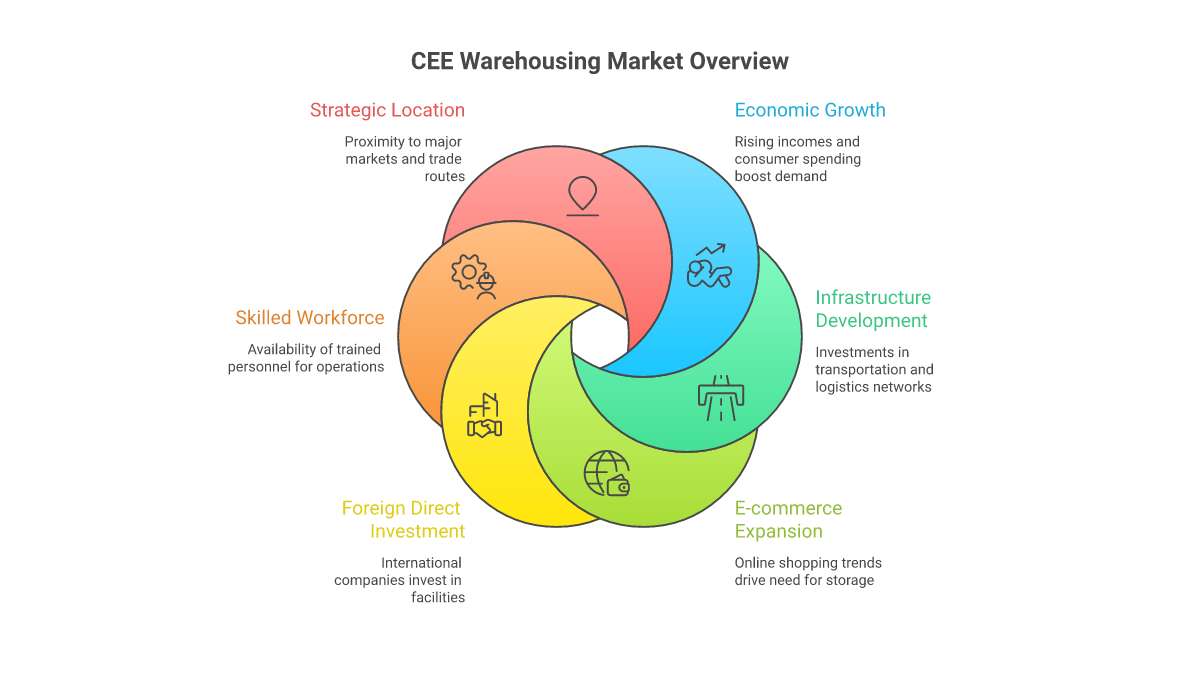
Market Overview and Growth Drivers in the CEE Warehousing Market
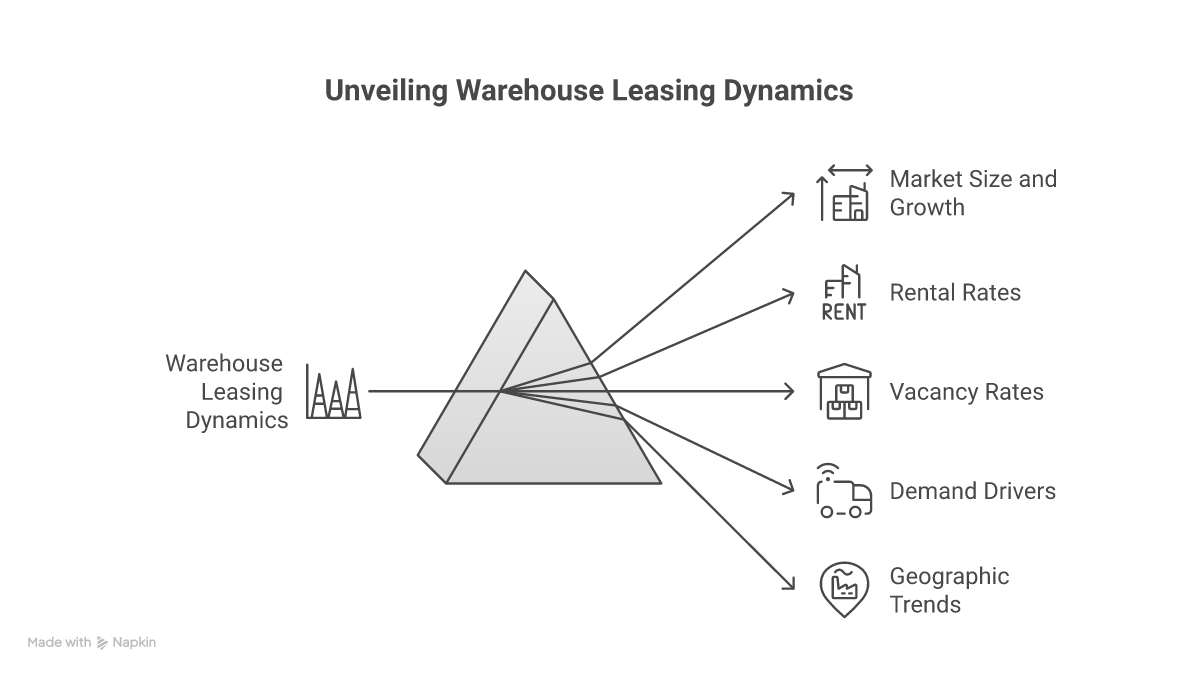
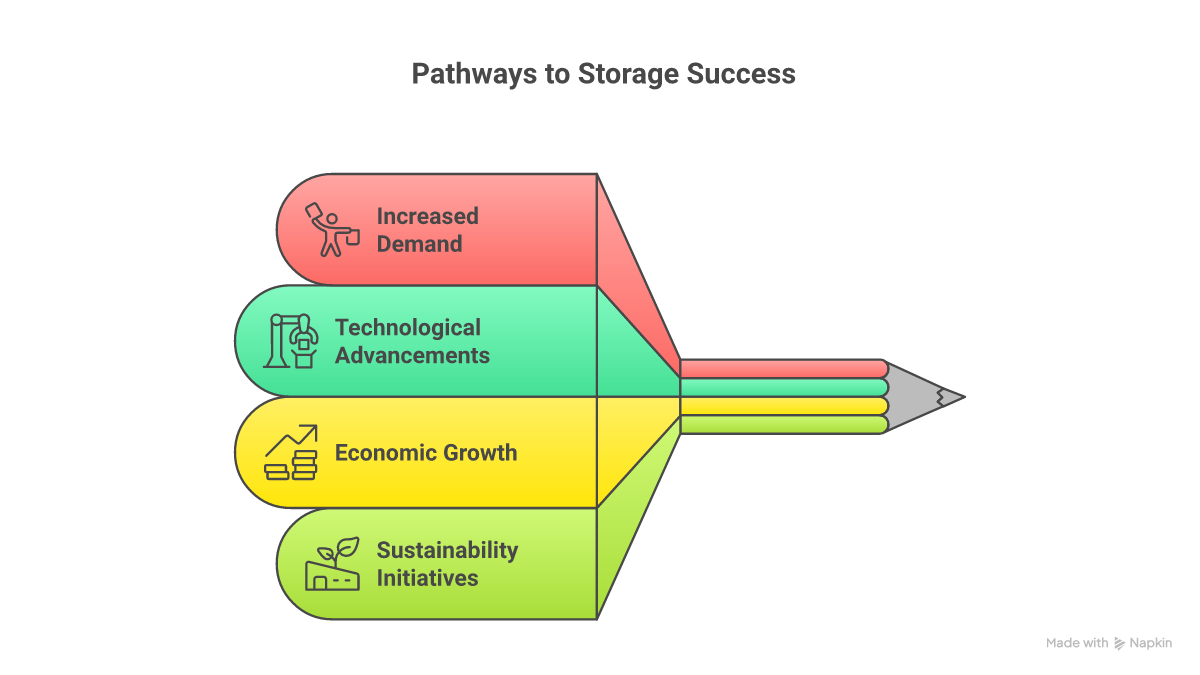
The sturdy performance of the CEE logistics sector is driven by several fundamental growth elements that set it apart from other European areas. Investment volumes soared to €5.36 billion in the first semester of 2025, representing a 51% year-on-year rise. This boom isn’t uniform across the board—Poland leads with €4.2 billion in investment value, while areas like Romania and Hungary boast the highest growth percentages.
At the heart of this push is the rise in e-commerce, with online retail across the region growing at an impressive 21.5% annually—the fastest globally. This consumer behavior shift directly increases the demand for warehousing: Poland, for instance, topped 30 million square meters of cutting-edge industrial space in 2025. Similarly, Romania, the Czech Republic, and Hungary report robust warehouse usage growth.
The reshoring of manufacturing also emerges as a pivotal factor. CEE attracted €18.8 billion in foreign direct investment linked to electromobility, with nations like Slovakia and Hungary focusing on battery logistics and car production flows. Such industrial specialization drives unique logistics infrastructure needs, opening doors for developers who can meet these technical demands.
Modernizing infrastructure only accentuates these trends. Unlike Western Europe’s repurposed sites, CEE markets primarily develop new sites with top-notch specifications. This allows for the best facility design, integrating sustainability and automation from the start. The payoff? Operating costs are about 35% less than equivalent locations in Western Europe.
The labor dynamics in these regions make them even more appealing. While Western Europe struggles with labor shortages and high costs, CEE countries provide a skilled workforce at competitive rates. This allows logistics operations to scale effectively, a vital factor for those extending their European networks.
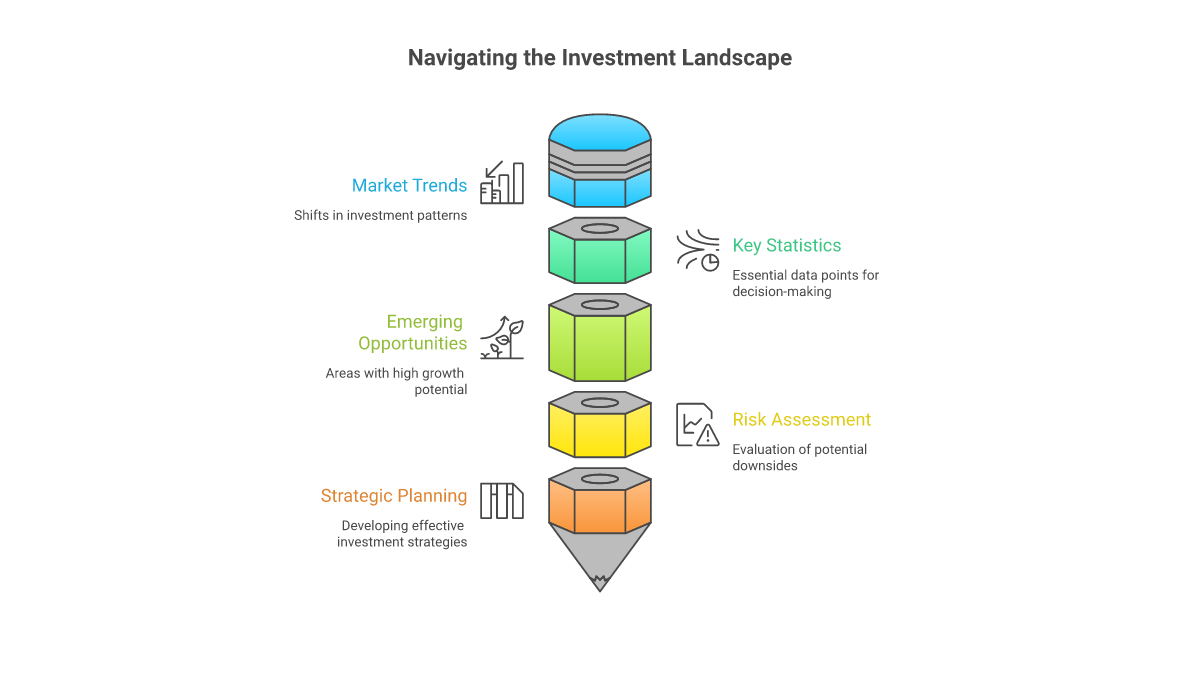
Investment Landscape and Opportunities
The investment proposition for CEE logistics has become considerably stronger by the close of 2025, underpinned by significant metrics that enhance long-term value prospects. Portfolio deals made up 58% of the total trade volume, underscoring a solid institutional presence and the sector’s maturity. Noteworthy transactions included Czech fund Investika’s purchase of five 7R parks and various cross-border deals exceeding €200 million.
An examination of yield dynamics reveals much about market stance. Prime logistics yields across CEE settled in late 2025, ranging from 5.5% in Warsaw to 6.25% in less central Polish markets. This offers a 75-100 basis point premium compared to their Western European counterparts, providing investors with attractive risk-adjusted returns in a sector brimming with strong fundamentals.
The sources of capital are diversifying too, as Asian investors notably increase their presence. Funds from South Korea and Singapore made up 23% of transaction volumes in 2025, particularly in logistics assets linked to Hungary and Slovakia’s manufacturing sectors. This widening investor base enhances market liquidity and affirms the area’s promising long-term potential.
Development activity aligns closely with market cues. Just 3.8% of Europe’s stock was under construction by mid-2025, with speculative development dropping off significantly in France and across Western Europe. Conversely, CEE markets maintain well-matched development pipelines with absorption rates, seeing pre-leasing rates of 65% for projects initiated in 2025.
Asset quality is on the rise, with new projects integrating state-of-the-art automation and eco-friendly features. Investment in the technological infrastructure of logistics properties hit €2.8 billion in 2025, a leap of 45% from the previous year. This focus on building assets for the future ensures competitiveness and retains value over time.
Regional Market Dynamics
Within the CEE area, specific characteristics in different markets reveal diverse investment opportunities. Poland stands out as the regional forerunner, holding nearly half of the CEE-14’s logistics stock. Its market maturity means there’s a widespread availability of institutional-grade products and strong liquidity for secondary markets—key factors for core investors.
The Czech Republic is particularly adept at managing cross-border logistics, leveraging its central position and strong infrastructure. Investment reached €2.1 billion in the first half of 2025, with an increasing role played by domestic capital alongside international investors. The market effectively balances new development with asset optimization.
Hungary’s market development is largely centered on supporting manufacturing, especially in the electric vehicle and battery production industries. This focus creates a demand for custom-built facilities and opportunities for developers with expertise in specialized industrial logistics infrastructure.
Romania shows strong growth potential, with logistics space expected to reach 8 million square meters by the end of 2025 and aiming for 11-12 million square meters by 2030. The market is fueled by regional e-commerce and reshoring of manufacturing, making industrial property investments all the more appealing.
Slovakia, strategically positioned between major CEE economies, presents distinct opportunities in cross-border logistics. A single hub in western Slovakia can serve 45 million consumers within a 500-kilometer radius, fueling demand for regional distribution hubs.
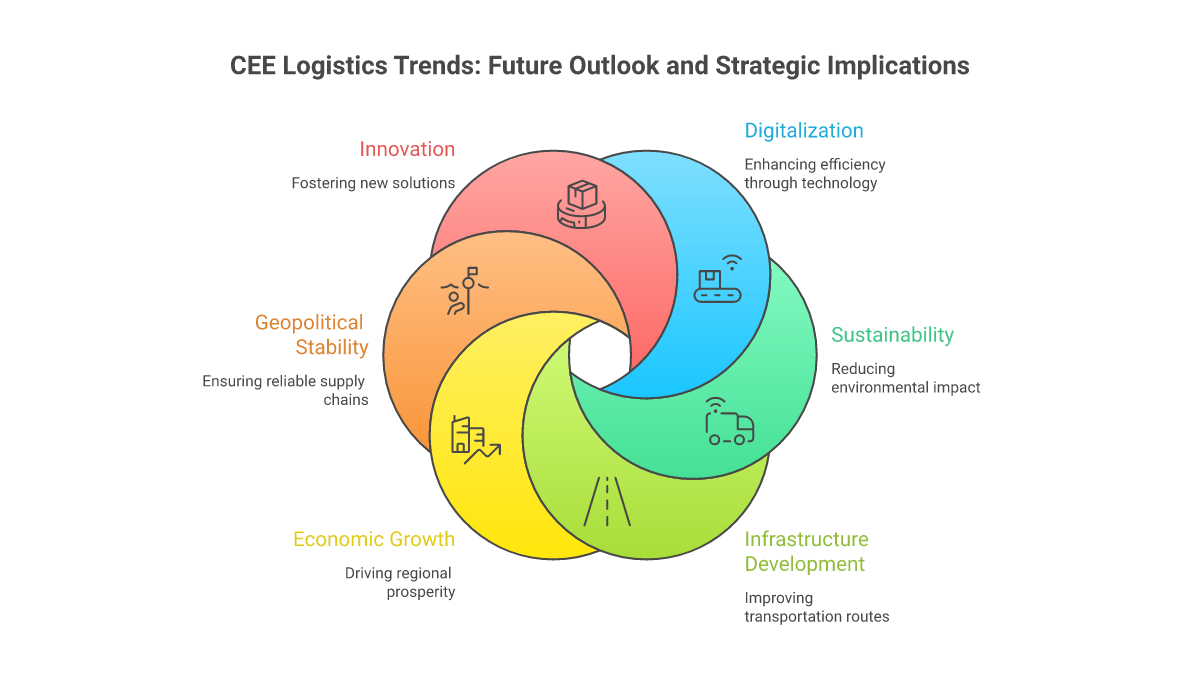
Future Outlook and Strategic Implications for CEE Logistics Trends
Gazing ahead to 2026-2027, several pivotal trends are expected to shape the market’s trajectory. Demand from occupiers remains buoyant, with 47% of European logistics occupiers planning expansions and only a small fraction, 4%, eyeing reductions. This robust demand outlook supports ongoing market growth while maintaining a healthy balance of supply and demand.
Technological integration is on the rise, with investments in automation and robotics expected to grow by 32% annually until 2026. This trend offers significant advantages to CEE markets, where new logistics facilities can incorporate cutting-edge technology from the outset instead of retrofitting existing buildings.
Sustainability considerations are increasingly pivotal in investment and development decisions. New projects are expected to meet high environmental standards, with 85% of developments launched in 2025 aiming for BREEAM Excellent or equivalent certifications. This focus on sustainable buildings secures investments and satisfies growing demands from occupiers.
Market maturation continues apace, enhancing transparency and availability of products meeting institutional standards. The increasing presence of global investors and operators boosts market standards and creates exit opportunities for pioneering investors and developers.
Capital market signals indicate escalating investment flows, aided by expected monetary policy easing in 2026. As financing costs decrease and risk margins stabilize, transaction volumes should pick up, especially in core markets featuring robust fundamentals.
Conclusion: The Future of CEE Distribution Centers
The CEE logistics sector presents appealing investment prospects, underpinned by powerful structural growth drivers. For investors, the opportunity is in pinpointing assets and markets that align with long-term trends in e-commerce, manufacturing, and supply chain restructuring.
Success in this landscape requires a keen understanding of specific market dynamics and timing. While core markets offer reliability and liquidity, emerging submarkets promise higher returns through development and value-add strategies. Mastering these intricacies is vital for effective capital distribution.
As the market matures, those who can deftly implement sophisticated strategies while managing risks will benefit most from the area’s ongoing evolution into a key European logistics hub. The secret lies in aligning investment tactics with market opportunities, always focusing on long-term value creation drivers.